

Leaderboard
-
nicknorman
Member11Points23,984Posts -
Wanderer Vagabond
Member10Points4,034Posts -

cuthound
Member9Points15,700Posts -
alias
Member7Points1,458Posts




Popular Content
Showing content with the highest reputation on 14/08/25 in all areas
-
6 pointsVaries widely according to the canal and even the bit of the canal. But surely if you are content to chug along at 2mph, you are not on a schedule. So why not pull in to the towpath side and stop to let the other boat pass? It’s only going to add a minute to your journey time, whilst saving the boater behind potentially hours of frustration. It’s all about being considerate to other people. So let’s have less virtue in going slowly, and more virtue in being considerate.6 points
-
Because they were made aware of it and could have it fixed, if not it would have gotten worse. Dear anyone who has been watching or listening to my ongoing drone about my deposit... I've been quiet because things have been happening behind the scenes. You will all be glad to know that the saga is now over, with me being in receipt of a full refund as it happens, which I wasn't expecting so fair play to them. The moral of this story is if you think you are in the right, both legally and morally, don't be afraid to fight your corner. Even if you fail at least you know you did your best. Thanks for all the helpful suggestions as well, very much appreciated. 😊5 points
-
4 pointsIt always rains on a Bank Holiday so why don’t the government simply give us more Bank Holidays? a week of them bunched together might help? a month of them back to back would be perfect. I’m sure it’s pissed down every bank holiday so far this year, if I were a gambling man I’d bet on rain this coming Bank Holiday.4 points
-
Ah. The obvious explanation, with the Earth being flat and all, is that the water's gone over the edge.4 points
-
3 points
-
3 pointsAgree with all you say about mobile phone use, all that I'd add is that it is equally bad how much 'stuff' on the cars I've hired are operated by 'touch screen' which is just as distracting as mobile phones. When I want to turn the heater down or up for example I just want a knob that I can reach across and turn either clockwise or anticlockwise to get the desired result, something that I don't have to look at. With these feckin' touch screens, trying to do it without taking your eyes off the road often means you turn the radio on, or something else that you didn't intend3 points
-
3 pointsBut, dear boy, it is just you on this forum. It is, therefore, "the great majority of people" called Justin, but no other pillocks.3 points
-
3 pointsThat would only be relevant if CCers were moving their boats purely to satisfy the requirement of their licence conditions. Since everyone with a CC licence assures us that's not the case, and they're cruising around the system as a lifestyle choice rather than to exploit a loophole in the licencing system, it wouldn't make a difference...3 points3 pointsIt's odd when those who believe no one should be in any sort of hurry have insufficient spare time themselves, to permit a boat to pass.3 points3 pointsThe problem, as has been commented above by @nicknorman, is that not everyone has the complete flexibility to do that. If you have a fixed number of days to complete the journey to a set point, be that a hire trip or moving a boat to a mooring, you can’t afford to slip a couple of hours a day. Even if you build in contingency, you can only add so much. That means in the end that you have no choice but to run longer hours to keep on track. Overall I don’t mind doing that, and it usually starts to get much quieter after 4pm which gives a good few hours, but given the choice I would prefer to work efficiently and tie up at 7pm than follow someone working inefficiently and tie up at 9pm (or stop and wait for everyone else to finish and work through until midnight). I have noticed post-Covid the same mentality creeping in on some roads. A perfectly sensible, reasonably wide A-road with a 60 limit will now often have someone pootling down it not quite reaching 40. Individually they may only be doing 10 miles or so but if you catch a succession of them then your 1hr journey can often become 1hr20. If that’s each way on your daily commute, and the extra time drags you into a busy traffic period, you suddenly find 5hrs of your week are disappearing into sitting behind people. I sometimes find myself contemplating that, if they want to do 15mph less than me, would it be equally reasonable for me to sit in front of them at 15mph less than they want to do, ie 25? I then think life’s too short… Yes, roads are more often a necessity and canals a pleasure, but you could transpose the above driving behaviour onto waterways and locks. In the end some users do need to get somewhere on both. Alec3 points3 pointsYou do realise that for Justin it's all about ME ME ME -- he should be free to do what he wants without any namby-pamby rules put in place for the good of society restricting his "freedom"... 😉 No amount of facts or statistics or pleas about society or the effects of his "freedom" on other people are going to change his mind, you might as well argue with a pigeon... 😞3 points3 pointsI think possibly these days the greater cause of car crashes is mobile phone use, or inattention caused by fiddling with the buttons while driving.3 points3 pointsIn a rush, no. But moving quickly and efficiently is a very different thing. Some boaters are into bird watching, some in visiting pubs, some in lockside chats ..... My main interest is the skill of boating, skills that can gained and improved no matter how long you've been at it. I would get edgy if I found myself behind someone who went incredibly slowly, but there's not a lot of point in trying to make them speed up. I would also hesitate to try to give advice - it may not be appreciated.3 points2 pointsHere’s the details. Description and photos, looks a nice little boat for weekends and holidays, seating converts bed,may not suit everyone 🤔


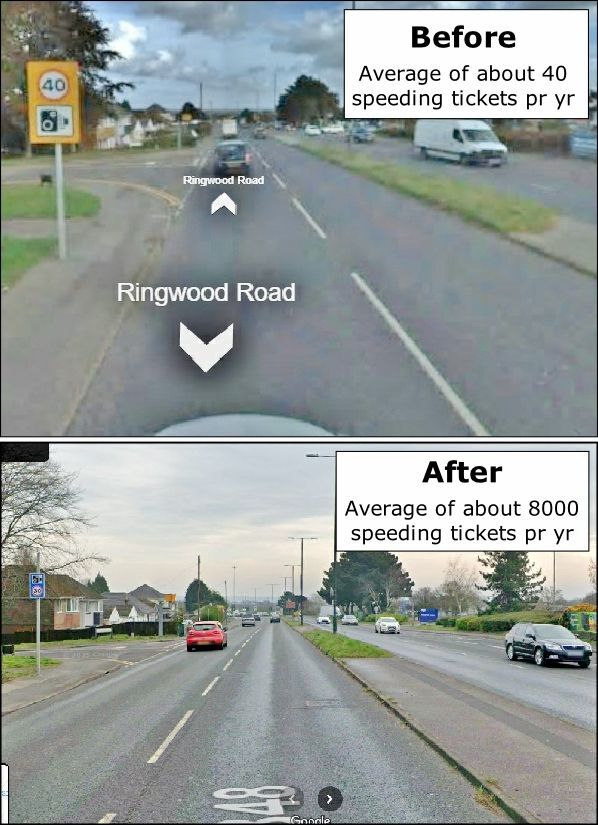
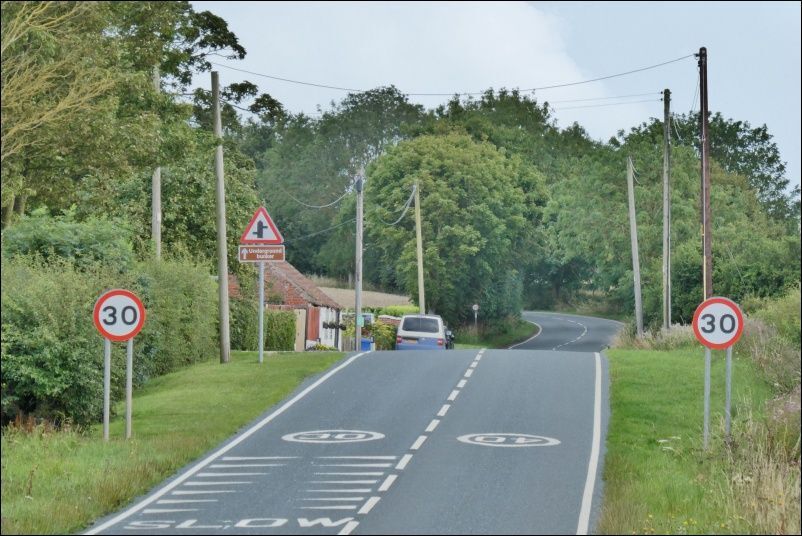
 2 points2 pointsI bought a motorbike (only 125cc) when I had a midlife crisis at 40. Had to sell it as I, quite literally, toppled over twice going round corners too slowly. The first time was riding the bike back from the dealership. My husband (a high-powered bike rider) was not impressed. 🙄2 pointsThe boat doesn't have a licence number displayed, nor from the photos, a name (although that could easily be painted over by a thief).The front door doesn't look green in that photo, although that's what the OP says. Are there other changes to the boat's appearance since those photos? Where exactly on the Regents did it disappear from? Which direction was it facing (although at 38ft long there are many places where it could be turned)? When was the last time you saw it - presumably some time on Sunday 10th, but early or late in the day? Can any of your boat neighbours confirm that it was still there later than when you last saw it? Did any of them see it being moved? Can you confirm that the boat has a current CRT licence (and Boat Safety Certificate and insurance)? @horselover1999, You will have observed that this forum gets quick (if not always helpful) responses. You will also note a degree of scepticism about 'boat stolen' posts. So if you want help from here, it is very much in your interest to come back regularly with responses to questions and updates on your search (e.g. which lengths of towpath you have cycled). But if you don't come back or are evasive in your responses, people may assume the situation is not quite as you have described it, and that will impact on their willingness to help.2 pointsSo they (CRT) controlled the weather with chem trails to create the drought to coincide with the licence review2 points2 points2 points2 points🥱🥱🥱🥱🥱🥱🥱 Can you supply us with any evidence that you personally can corroborate having spoken with the 'great majority' of people in this country on the subject (say circa 35 million or so), otherwise, as usual, you are talking bullox.2 points2 points'Traditional' narrow boats do have a flat bottom all the way to the stem post. The upswept baseplate is a recent introduction, done mainly so that you don't need to add triangles to the bottom of the side plating as they curve round towards the stem post. All done for cheaper/easier fabrication, and nothing to do with efficient hull design.2 pointsA bicycle is good for this. Facebook London boaters and River Thames Boaters. Also tell the CRT. I doubt it is far away and a bike ride in one direction is 50/50 likely to find it. I would go Paddington arm first as that is more remote and somewhere a bad actor would be able to do something more easily like repaint it. Unlikely to have come off CRT water as it is not possible to get out of Limehouse or Brentford other than by booking passage using your CRT licensing account. It will be on the GU or river Lea navigation. . As a backup I would also contact P&S marine in Watford as they handle a lot of road transport jobs. Outside chance if organised that it could have been put on a truck. I am not sure how arduously the boatyard check ownership. I recovered a narrowboat on the Thames recently which had been taken away without owner knowing. It turned out to be his ex. She had broken in and driven it a few locks down the River and he did have the keys so it was technically a theft but a domestic not a random. He clearly had no idea where it was. The successful recovery was facilitated by facebook Thames Boaters. Lots of people do go on fb so it is quite a handy tool. I am blocked from fb London Boaters due to my anti NBTA position so I can not place content on there. Someone else may be able to. It's a big group with a lot of followers.2 points2 pointsTheones that really p**s me off are the ones who come up behind you when passing moored boats, or fisherman - when I speed up at the end they disappear back into the distance, until come the next lot of moored boats when they’re right behind me again - they’re actually cruising at a lower speed than me, but since they’re not slowing for moored boats their mean speed would be higher than mine.2 points2 pointsNigel Farage got paid £40k to give a keynote speech at an event to help people become economic migrants. It's OK, though, because they will be in big boats, not small ones. https://goodlawproject.org/uk-brain-drain-farage-is-playing-both-sides/2 points2 pointsYou can let someone past almost anywhere if you want to. Just throttle right down and pull over to a stop if necessary, if you push the bow bankwards it will get you sucked back roughly into the middle again. Or as Nick suggests moor up for a minute. It’s been interesting reading some posters here who’s “canal time” has got to the point where they don’t appreciate others do have a schedule and do need to get somewhere at a point sooner than the poster recognises. One persons good speed is another persons too slow. Just let them past.2 points2 pointsGive it up immediately. Stop for a cuppa or lunch or something. Life is too short to let tossers like this get under your skin.2 points2 pointsMy reply was always " it's half past three" I could never hear them properly without my hearing aids in.2 points2 pointsI have to say I find it very irritating when supercilious people say “Oooh you mustn’t rush on the canals!”. It is a very selfish attitude put about by “holier than thou” people. First of all, wanting to make reasonable progress, as opposed to taking every opportunity to waste time and be inefficient, isn’t rushing. It is being expeditious and not pissing about incompetently, virtue signalling about how clever they are not to have any commitments. Secondly sometimes people don’t have the benefit of having absolutely nothing to worry about other than how much time they can waste whilst waiting to die of old age. People have reasons to be at certain places at certain time. Hire boat returns. Getting to the shops /pub before closing. Meeting relatives off a train. Suddenly being told that a relative has been taken ill and needing to get back. Many and numerous reasons why people have a schedule. So anyone who thinks that no-one should ever need to be on a schedule is thoughtless and stupid.2 points2 pointsIanD has explained it properly. I can only add that intuitively I doubt the design would make any discernable difference to fuel consumption at the speeds most canal boats travel. It sometimes makes me laugh when I hear things described as ECO this or that, because most of the time it's just people wanting to make themselves feel good while at the same time indulging in copious consumption. Like when Kevin McCloud describes a huge project on Grand Designs as an "Eco-house" because it's well insulated and has some special windows that reduce heat loss. He completely ignores the embedded energy & emissions required to build an enormous building and that it's completely unsustainable for 2 people or a small family to live in a building of that size. Likewise, if you want an "Eco-boat" don't commission a special design. The best thing you can do is buy a second hand boat that's already been built.2 points1 pointTaller than the average Morlock then, or a smaller umbrella? I used to have terrible trouble with sunburn while boating, and used to cover up and suffer. Riemann P20 applied once a day changed it all. I still need a hat as the top of the head seems to have inadequate intrinsic shade and blood flow to dissipate the heat...1 point1 pointReally ! Do you think it's got anything to do with the incoming tide that runs upriver twice in approximately every 25 hour period ?1 pointYou do seem to major in talking total bullox, don't you. On the one had you seem to be saying that for £4,100 you wont get a bad car, and simultaneously saying Caveat Emptor applies, well why would it need to if you cannot find yourself buying a pile of crap, which is what you seem to be saying. I said that a cheap ICE is just as likely to be a pile of crap, to which you both disagree, and agree, apparently1 point1 point1 point1 pointThey were actual speed limit repeaters, not speed camera signs with minute speed limit signs underneath them : Ringwood speed camera : Ludicrous (but at least well signposted) speed limits on the A1033 to Withernsea : Incidentally I was talking to some of the people who live around there and none knew why those ludicrously low limits were introduced " a few years ago", but they didn't like them because "it takes an age to get any where"..... I have never said, nor would I say, that I am a perfect driver, so I do not even know where you got that from.
 1 point1 pointSpeaking to people who have tested them, a Schilling rudder, they say they are light and balanced on the arm while steering, but you need a lot more water flowing through the swim/rudder to make them work on the turn, compared to a traditional blade rudder. A well known shell builder says there’s very little benefit on a Narrowboat, but very effective on bigger boats like Dutch barges. That’s why they don’t fit them.1 pointPost the crime number here ASAP because there have been any number of similar asks over the years that turn out to be anything but what we were originally told. Often "illegal" boat rents to purchase, disputes between owners, and attempts to trace a partner who has good reason not to want the poster to find them. Once we have the number, and ideally photos, maker, and identifying features you may get help. Contact the London Boaters Facebook group. Beg or borrow a cycle and go for a few long canal side rides. There are not than many routes they can take out of London. As CaRT for any help they can give - it probably won't be much.1 pointWelcome to the forum and sorry it has to be in these circumstances. Definitely get a police crime number and report it here. Inland boats can't travel very fast. How far could it have got since it was last seen at say 3mph. That gives you a radius to check for it on the towpath. Check with CaRT for their towpath sightings. Check with the lock keepers on the Thames, Limehouse and Brentford, to see if it has gone on to the river. Boat name and index number? Do you have a photo you can post? Any distinguishing features? The colour is irrelevant as it can be repainted on the towpath. You may encounter some scepticism here. Many cases of stolen boats are actually disputes over ownership, relationship break downs and so on. Actual theft by a stranger does happen, but it is rare. Not saying that is what has happened here, but you may hear that suggestion. Providing a crime number will help dispell that suspicion.1 point1 pointI am always sceptical about figures used by government to support policies. This is because of my experience on a course at the Civil Service College that I have mentioned in another thread, where we were split into two groups, provided with identical packs containing sets of genuine official statistics and a policy statement, one group being tasked with producing data showing that the statement was true, the other, that it was false. Real-life data is often contradictory, so it was a question of selecting the data appropriate to your task, or, when this was difficult, massaging the data to make it look as if it supported your task at a superficial glance, (for example by producing a graph showing the rate of change rather than the change per se, making it appear that something was reducing with time, when it was actually increasing, but less rapidly). Both groups managed to produce impressive-looking figures, not all of which would have stood up to a detailed analysis by someone who actually understood how to interpret them. The exercise was intended to illustrate a frequent real-life situation in politics, where policy is made first, often purely on idealogical grounds, and civil servants are subsequently instructed to produce data supporting the policy.1 pointAt first in 1989 we simply jumped. We bought boat number one with the remnants of divorce lol, would have been a nice deposit on a mortgage but we met a couple of couples who weirdly lived on a boat and off we bloody well went, zero money for property left. Adored it and never looked back. a few years later in work so bought a house for days off in the harbour in Looe Cornwall and later on different houses but in 2007 wasnt using it much so sold and had no property till we bought this house in 2021. Did have the sense to keep the boat in good order and save a few quid so if we ever had to downgrade to a house we could without borrowing any money. and yes Downgrade is without doubt the correct phrase moving into a house to live, houses are for holidays and boats to live on.1 pointI think you'll find it's due to CRT incompetence but yes, low water levels are ultimately what affects this decision.1 point1 pointI don't suppose Justin has bothered to find out whether the proportion of children of working class parents amongst Labour candidates is as low as the senior civil service. A detail that seems to have been forgotten in this diatribe is that while this internship scheme is exclusive to students from working-class backgrounds, it does not affect the eligibility of other candidates to apply directly to the Fast Stream.1 point1 pointIt's a very nice boat. I like the cross bed, especially if it properly makes use of the design and is 5ft wide. Biggest downside is no stove and no obvious place to put one.1 point1 pointI still cant get my head around why you are so fixated with this issue, it has nothing to do with you does it? (or are you a secret trans?). For me the question is why we actually need Ladies and Gents toilets at all. In my local area they have been replacing the old, (and rather unpleasant now) Victorian toilets with self cleaning unisex one's at 30p a shot. Of course if men weren't so gross as to p*ss on the toilet seats (something that the women somehow object to ) they could possibly have made it cheaper and saved money on the self cleaning side of it, but we all know that many men are not capable of 'hosing' accurately. Much the same goes for sports/swimming changing rooms, why can't they all be of the unisex changing village type, where we all get cubicle to change in? or do you prefer the 'all boys in together' in the all male changing rooms? For both toilets and changing rooms of the unisex type there is no ambiguity, everyone uses the same one whilst maintaining privacy, what's not to like about that? Except for those who spend their lives looking for something to be 'outraged' about.1 point1 pointEveryone makes mistakes. Some admit their mistakes and seek to learn from the experience, rather than find reasons it couldn't have been their fault.1 point1 pointI can't see that particular advert but there is a reason why second hand EVs are cheap - nobody wants to take the risk with them. A 10-15 year old ICE with average mileage and a good service history should go on for another 5 or 10 years if well maintained. A 10 to 15 year old EV with average mileage and good service history will probably be needing new batteries (depending on how many charge cycles it has done) at some point in the near future, if not already done.1 point1 pointAccording to my policy Craftinsure use Zurich, who are not exactly small, fly-by-night, or likely to go bust... 😉1 pointThis leaderboard is set to London/GMT+01:00















Important Information
We have placed cookies on your device to help make this website better. You can adjust your cookie settings, otherwise we'll assume you're okay to continue.